Runing kernel autotests
About kernel autotests
Camelot-OS Sentry kernel hold a complete test suite that is made to check all the kernel application interface and also verify some kernel behaviours (such as capability usage or performances).
The autotest test suite is implemented in the kernel sources autotest subdir, and is written in both C and Rust, so that it can validate both usages of the kernel userspace programmative interface.
Sentry kernel in autotest mode is not made to include third-party applications but instead is seen as a standalone firmware build that allows runtime checks. See autotest chapter of the Sentry kernel documentation for more informations.
Setting Up the Sentry Kernel Build Environment
Install Required Tools
First, clone the Sentry kernel repository and install Python dependencies:
git clone https://github.com/camelot-os/sentry-kernel.git
cd sentry-kernel
pip3 install -r requirements.txt
This installs the Meson build system and other helpers needed to configure and build Sentry.
In order to compile the kernel, you also need toolchains. One gcc cross-toolchain that you can download, for example, on the official ARM repository. Note that for cortex-m or cortex-r 32 bits architectures in bare metal mode, you need the arm-none-eabi targetting toolchain.
Because Sentry-kernel is using Rust for the user API library, you also need a rust toolchain. See the rustup cross-toolchain page for more information on how to install the corresponding toolchain.
Configure for Autotest Mode
Sentry uses the Meson build system. To compile your kernel in autotest mode (which enables integration tests and special autotest firmware), you need to:
Select the kernel configuration
Defconfig file
Sentry-kernel (and all Camelot-OS) uses Kconfig for its configuration, in the same way projects such as Linux kernel or Grub do for their configuration step.
There are some sample defconfig files in the kernel config directory that configure the kernel in autotest mode. Select the file you need based on the board you wish to validate Sentry kernel against.
This defconfig enables the autotest support for your chosen board, and generate the .config file in the directory where you launched the defconfig command.
Device-tree file
Alongside the config file, Sentry also delivers custom device-tree files made for autotest, for various boards. Be sure to be homogeneous between the defconfig and device-tree file. The device-tree file is made to define the devices that will be used and the memory areas that are distributed among all applications, including the kernel.
In autotest mode, the firmware only hold two applications, being:
- the idle task, which is automatically called if no other task is eligible
- the autotest task, responsible for executing all the kernel testing requests
both applications are part of the kernel repository, so that there is no need for an integration project in autotesting mode.
Cross file
Cross-files are used in order to define the hardware target properties and how the cross-toolchains are deployed on your host. Because these files are used to declare how the development environment is set, they are not a part of the Sentry-kernel repository, but instead under your own control.
In order to help with this step, and also because they are used in the project CI jobs, there are multiple cross-files that matches the Sentry-kernel requirements in the camelot-os cross-files repository, that you can use directly, or modify depending on your own environment configuration (toolchains paths and so on).
See meson cross-compilation manual for more information about cross-files.
Set Up a Build Directory
Now that all your input configuration data are clearly identified, you can setup the kernel build environment in autotest mode. A typical setup of Sentry kernel in autotest mode is then the following:
Build the Kernel
Once Meson is configured, compile with Ninja:
This produces a firmware image (e.g., firmware.hex) with autotest support baked in at the root of the build directory.
Use Robot Framework for Automated Testing
Sentry’s autotest system is designed so that Robot Framework can parse and report test results. The repository includes Robot test files under tools/robot/.
This framework is made in order to flash, start and dump the autotest results to validate all delivered results in a pretty-printed report. This report simplify the kernel test suite analysis and is made in order to allow CI-based report deliveries.
Install Robot Framework & Dependencies
Install Robot and protocols to talk to a target (for example via PyOCD or serial):
These packages allow Robot to interface with hardware debuggers and serial ports used by microcontroller targets.
The roboframework-pyocd is a package that has been made by the H2Lab Camelot-OS team in ordrer to enable the usage of pyocd tool with robotframework, in order to automate the action of flashing running and dumping the tests.
Run Autotest tests and get report
You need to know what is the jtag probe identifier to help with the board identification for flashing. This information is easily accessible using pyocd using the list argument:
pyocd list
  #   Probe/Board       Unique ID                  Target
---------------------------------------------------------------------
  0   STLINK-V3         004300483232510239353236   ✔︎ stm32u5a5zjtxq
      NUCLEO-U5A5ZJ-Q
To execute the autotest suite with Robot Framework and generate logs and a structured report, run:
FIRMWARE_FILEpoints to your compiled firmware.PROBE_UIDis the ID of your debug probe (e.g., ST-Link) from tools likepyocd list.-d resultsoutputs the test logs and report to theresultsdirectory.
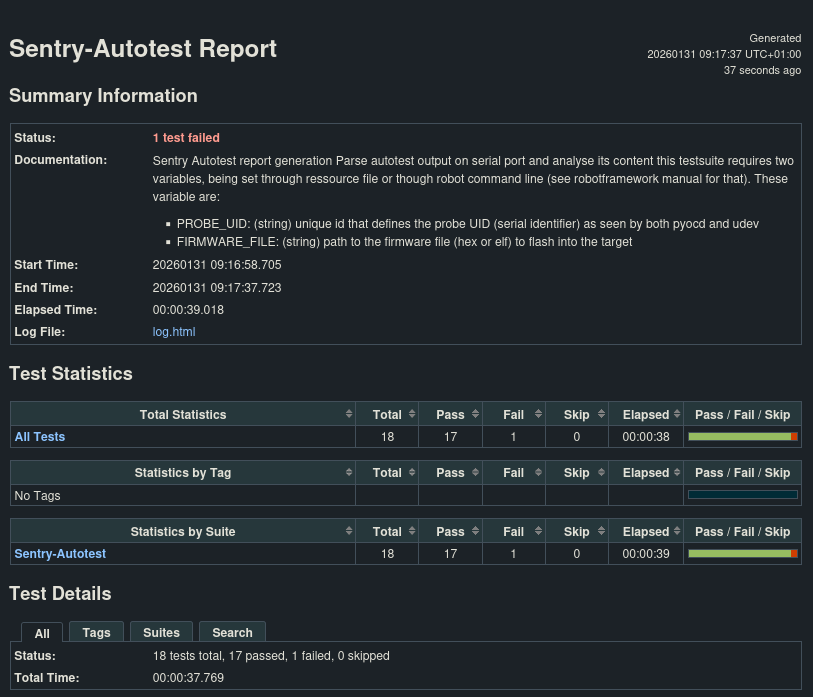
After the tests run, Robot Framework produces:
report.html– an interactive HTML reportlog.html– detailed execution logsoutput.xml– structured results useful for CI pipelines or further analysis
Caution: Be sure that no pyocd instance neither attached gdb or terminal is active when calling robotframework, as concurrent access to a JTAG probe is forbidden.
Interpreting the Results
Robot Framework’s report and log files document:
Which tests passed or failed
Timing, hardware interactions, and any error output from the target
Links to captured logs
You can open report.html in a browser to get a digestible summary of all executed cases.